Spoon's Audio Guide: Sample Rates & Sample Rate Conversion
Converting audio from one frequency to another is called Sample Rate Conversion (SRC),
or resampling.
Audio is recorded as individual points, at a spacing called samples per second, CD quality is 44.1 kHz, 44100 samples per second. Reducing the sample rate is called down-sampling, where samples are decimated (removed). Conversely, up-sampling inserts new samples, they are added (interpolated).
Why resample? there are many reasons: a recording studio might record at 192 kHz, from there it is mixed and mastered down to the end format, which could be CD quality (44.1 kHz). Up-sampling could be used to match the frequency of the project from lower sample rate tracks.
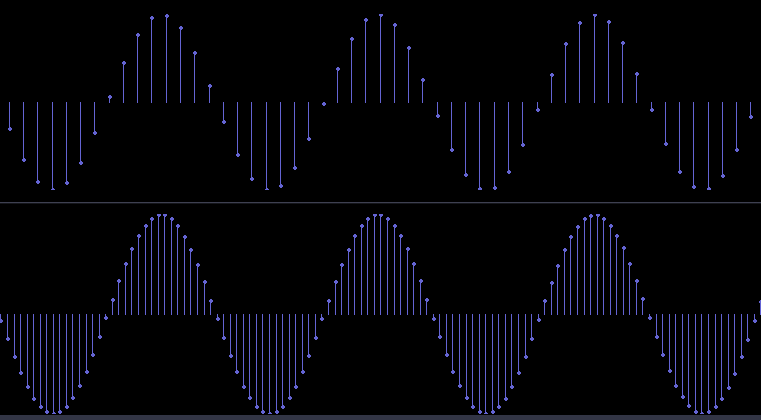
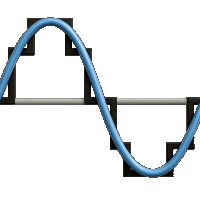
Take these two wave forms, they are the same wave form, the top one is sampled at 44.1 kHz, the lower one 96 kHz, there are more points (samples) in the 96 kHz version, the points are closer together:
Does this mean the 96 kHz version sounds better as it is less coarse? Not for this example wave form: sound is created using waves and both those wave forms would produce the same audio.
To answer your next question, higher sample rates can handle higher frequencies, 44.1 kHz can reproduce audio right up to 22.05 kHz, where-as 96 kHz can reproduce up to 48 kHz, this half the sample-rate reproduction is called the Nyquist frequency.
Factors Involved in Resampling
Illustrate created a test site
src.hydrogenaudio.org to highlight the performance of different SRC routines and visually see the various trade-offs which happen during SRC. We will go through each test and and explain how it relates to the audio signal.
Spectrogram
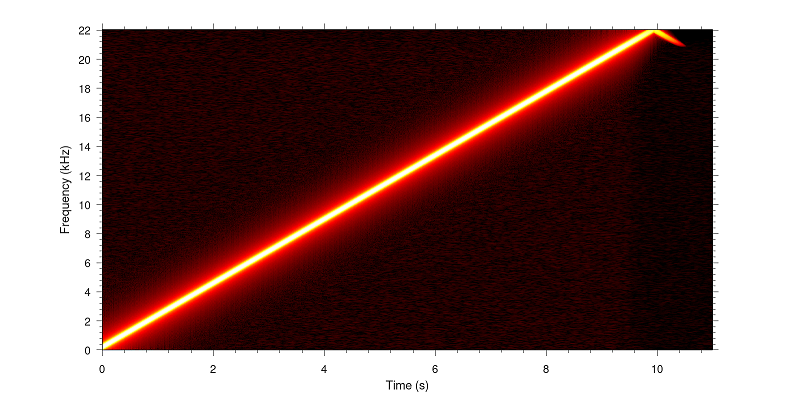
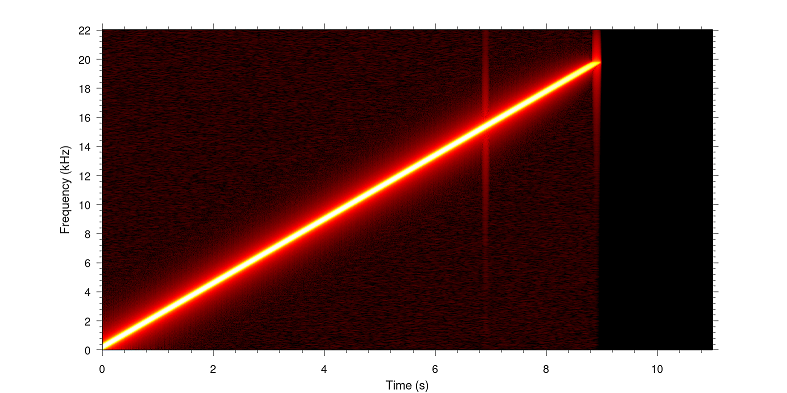
Perhaps the most revealing of all tests, a sine sweep from 1 Hz to 44 kHZ sampled at 96 kHz is down-sampled to 44.1 kHz. Obviously 44.1 kHz will lose any frequency above 22.05 kHz, the spectrogram will show what happens to the sound sweep, including the higher frequency audio which cannot be represented @ 44.1 kHz. An ideal representation is a single strong line:
"Fold-Back" or Reflection (Aliasing)
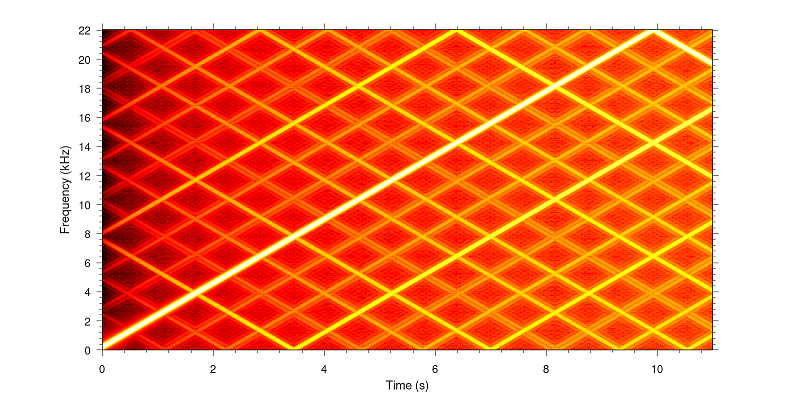
In SRC without a proper filter, the signal above the Nyquist (half the sample rate) can fold-back into the lower frequencies, instead of cutting off abruptly at 22.05 kHz, the signal continues, effectively 23 kHz and above is reversed back into frequencies below 22 kHz, represented as an inverted V:
Imaging Artifacts
Poor resampling algorithms can introduce "imaging" artifacts, that is the main frequency also has faint ghost lines running parallel. These are often caused by harmonic distortion or incomplete filtering, creating multiple, quieter echoes of the aliased signal at different frequencies:
Grid or Checkerboard Patterns
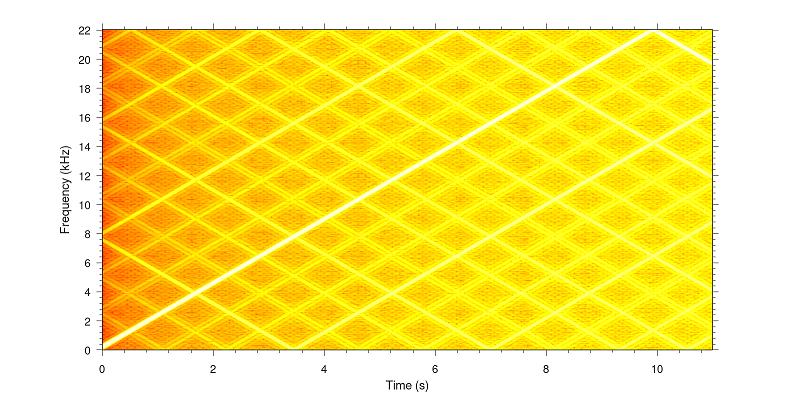
If the resampling algorithm uses poor interpolation (such as "nearest neighbor"), the background of the spectrogram which should be black (representing silence) might show a grid, the brighter the grid the more audible the defects, take these two:
The one on the left is bad, but not as bad as the right one, which would have very audible distortion.
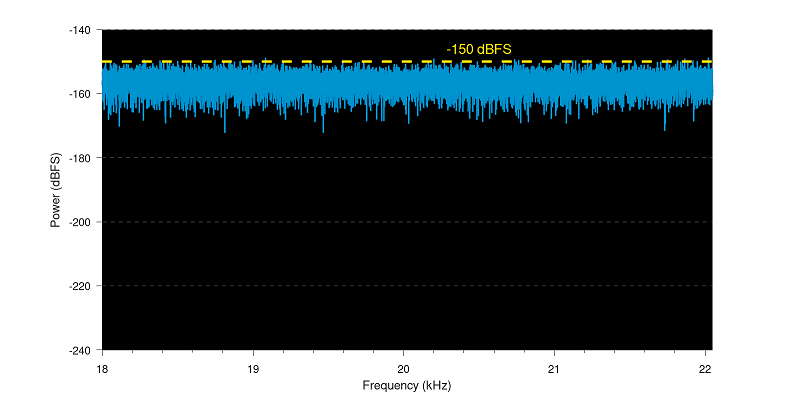
Strange Frequency Oddities
Finally mathematical flaws in SRC can introduce spikes at certain frequencies and / or noise (general background noise on the plot), in this example ~ 15 kHz and near the Nyquist there is an injection of HF and LF distortion, not to mention overall background noise:
Bandwidth
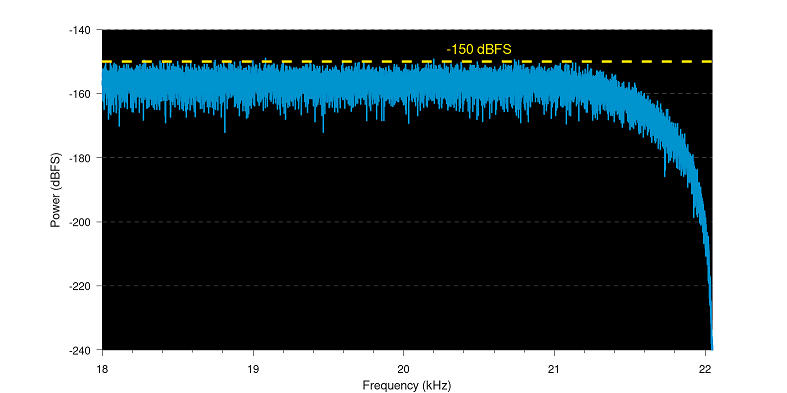
Bandwidth is the name given to the amount of frequency range preserved, for example an average SRC which has a 95% bandwidth setting, would start rolling off the frequency preservation at around 21 kHz.
Ideally SRC when down-sampling would preserve the full frequency range as defined by half the new sample rate, for example converting 48 kHz to 44.1 kHz this would preseve all signals right up to 22050 Hz, however most SRC need room at the top of the frequency scale to apply filters with a gradual roll off ensuring no aliasing, as seen from the Spectrogram plots aliasing distortion is not good.
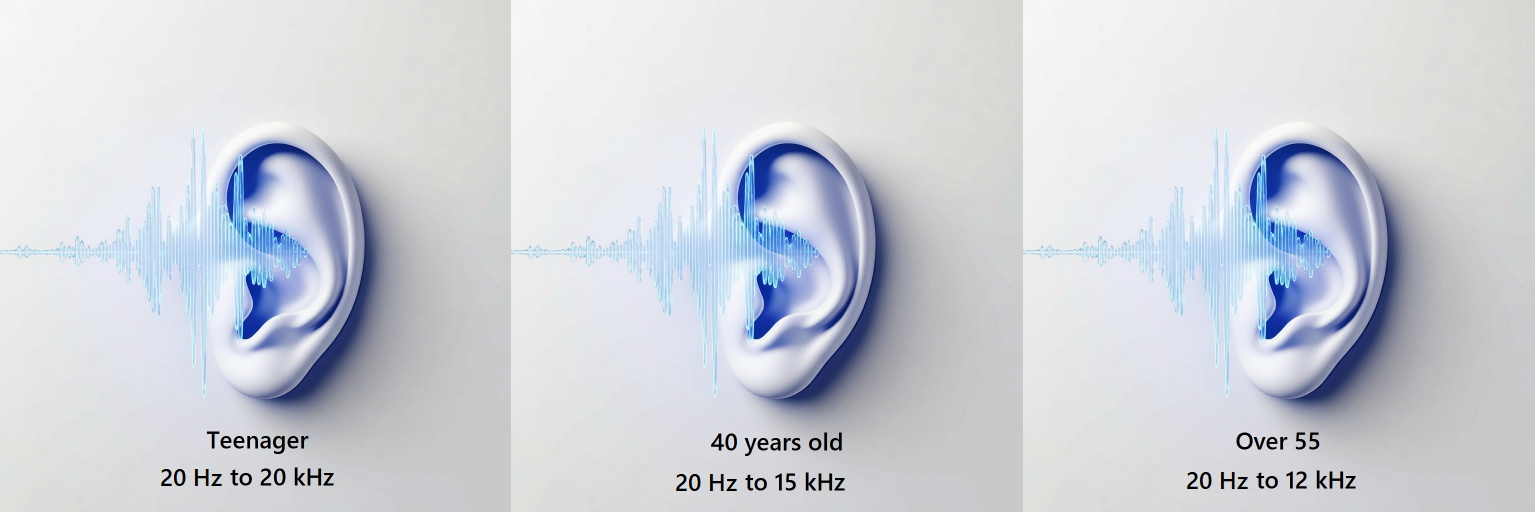
Let's touch on frequencies, CD quality was chosen at 44.1 kHz because it is higher than the hearing range of humans, this representation shows the upper hearing-range reducing as one gets older:
Losing a small frequency response at the top would not be audible to even the best ears on the planet. Back to SRC test suite, bandwidth is tested under the title
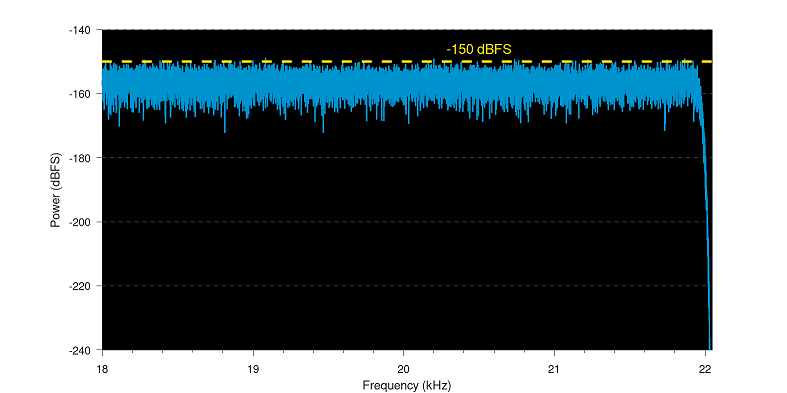
Nyquist filter, here are 3 different bandwidths (left has 95% bandwidth, middle 99%, right 100%):
Even the worst bandwidth of 95% in this instance, it is unlikely anyone would actually hear the reduction.
Pre-Ringing & Post-Ringing
Changing the sample rate can introduce pre-ringing and post-ringing, what exactly are those? Pre-ringing is where sharp sounds, such as the hit of a drum or the pluck of a string is echoed earlier by a small amount. Post-ringing happens after the sound event, normally it is masked by the sound itself and while still an artifact it is often masked by the natural decay of the sound itself.
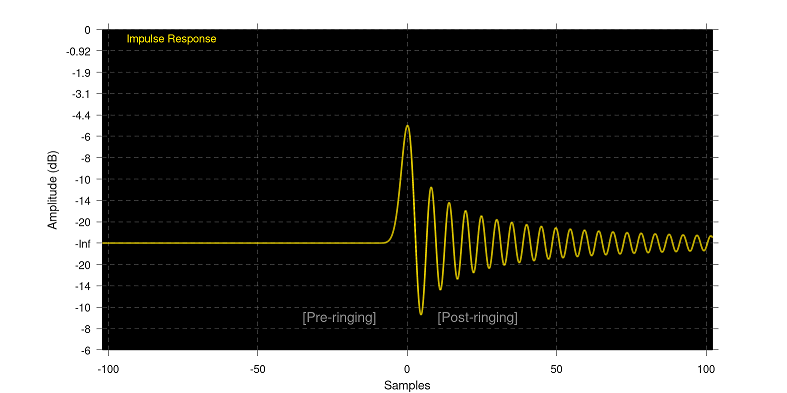
SRC linear filters introduce both pre and post ringing as shown by this plot:
The sound wave appears a number of samples early (the volume of the pre-ringing is very low, in comparison to the actual sound), at the same time there is post-ringing, the reverse of pre-ringing. Every SRC with a linear phase has balanced pre- and post-ringing.
Certain SRC have an option 'Minimum phase', the idea is to introduce no pre-ringing, the downside is that the ringing signal is pushed fully to post ringing and even more so, as previously mentioned it could be masked by the actual sound event:
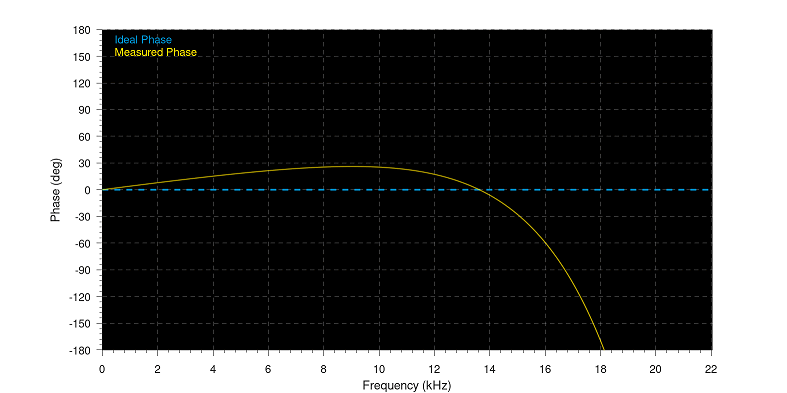
However adding a phase delay which increases across frequencies as 'Minimum Phase' introduces, can effect the stereo image, transient response, and overall clarity of the audio, this is the phase plot from a minimum phase SRC:
Gapless Considerations
There exist live albums, where the tracks do not have a traditional fade out pause between them, instead they form as one continuous piece of music, even though they are separate tracks. With the right gapless player, no break is heard.
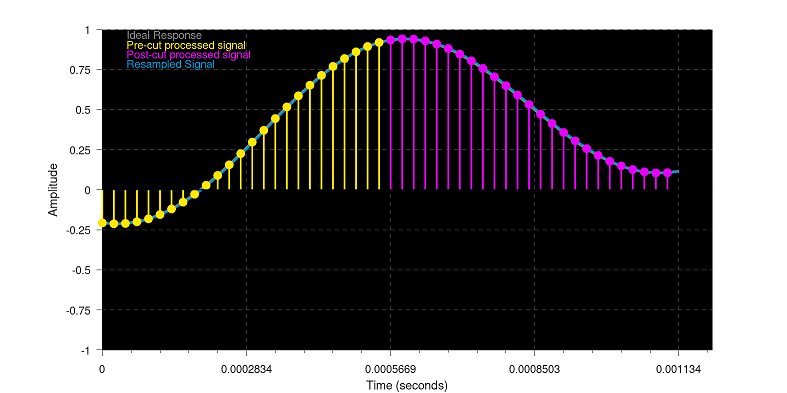
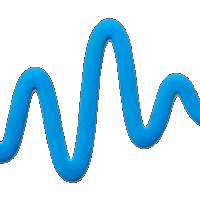
Consider this wave form, the yellow section is one audio track, the purple track the following track, the grey line is how the audio is supposed to flow one live track to another, yet these two files were resampled in a non-gapless aware SRC, and upon playback the blue line would be hit your speakers:
Not a good transition, not only is there a bunch of high frequency stuff going on at the join, the resulting wave goes well out of positive-range and would result in clipping. Instead, this is how it should be done:
Even though the SRC for the 2nd track did not know about the first, with maths, it can be estimated enough to not cause issues on the transition.
Balancing Act of Precision and Perception
As you can see (if you have made it this far), SRC design is a balancing act. Too much of one thing can be to the detriment of another: too high a bandwidth can introduce more pre-ringing, or aliasing 'imaging' through ghost signals.
Continuation of Audio Guide
Copyright © illustrate 2026, All Rights Reserved